
 WDC Pos
 Sales Hub
 Product Hub
 Inventory Management
 Whatsapp Marketing
 Marketing Automation
 Browser Notification
 Email Marketing
 Fusion Mail
 SMS Marketing
 Fusion SMS
How Sales Dashboards Help Multi-Location Businesses Make Faster Decisions
earn how sales dashboards help multi-location retailers monitor performance, compare stores, track KPIs in real time, and make faster, data-driven decisions.
Managing one retail store is challenging enough. Managing multiple locations adds another layer of complexity. Sales performance, inventory levels, customer activity, and operational metrics can vary significantly from one store to another.
Without a centralized view of business performance, managers often spend hours collecting reports from different locations before they can make informed decisions.
Sales dashboards solve this challenge by bringing key business data together in one place, giving decision-makers real-time visibility across every location.
Why Multi-Location Businesses Need Better Visibility
As businesses expand, reporting becomes more difficult.
Each store generates its own sales data, inventory movements, promotions, and operational metrics. When this information is stored in separate systems or spreadsheets, comparing performance across locations becomes slow and inefficient.
A centralized sales dashboard gives businesses a clear picture of what is happening across every store without waiting for manual reports.
What Is a Sales Dashboard?
A sales dashboard is a visual interface that displays important business metrics in real time.
Instead of reviewing multiple reports, managers can monitor key performance indicators from a single screen.
Common metrics include:
- Total sales
- Sales by store
- Revenue trends
- Average transaction value
- Best-selling products
- Customer traffic
- Inventory status
- Promotion performance
Having this information readily available allows businesses to identify trends and respond more quickly.
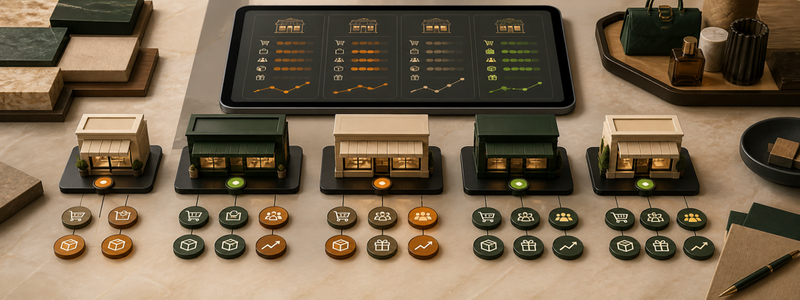
Compare Store Performance
Every location performs differently.
One store may experience strong sales growth, while another may struggle with declining revenue or slow-moving inventory.
Sales dashboards make it easy to compare locations and identify differences in performance.
Businesses can quickly answer questions such as:
- Which store generated the highest sales today?
- Which location has the strongest growth?
- Where are promotions performing best?
- Which stores require additional inventory?
- Which products perform differently by location?
These insights support faster and more informed decision-making.
Monitor Performance in Real Time
Traditional reporting often relies on daily or weekly reports.
Real-time dashboards provide immediate access to current business performance, allowing managers to respond as conditions change.
For example, businesses can:
- Track sales throughout the day
- Monitor inventory availability
- Measure promotion results
- Identify unexpected sales trends
- Respond quickly to operational issues
Real-time visibility helps reduce delays between identifying a problem and taking action.
Improve Collaboration Across Teams
Sales dashboards are valuable for more than senior management.
Store managers, operations teams, marketing departments, and executives all benefit from working with the same business data.
A shared dashboard helps teams align around common goals while reducing confusion caused by inconsistent reporting.
When everyone has access to the same information, collaboration becomes more efficient.
Turn Data Into Action
Collecting business data is only useful if it supports better decisions.
Sales dashboards help businesses identify opportunities that might otherwise go unnoticed.
Examples include:
- Increasing inventory for high-demand products
- Adjusting promotions based on store performance
- Identifying underperforming locations
- Recognizing successful sales strategies
- Improving staffing during peak shopping hours
Faster access to reliable information allows businesses to act with greater confidence.

Scale Reporting as Your Business Grows
As more stores are added, reporting should become easier, not more complicated.
A centralized dashboard allows businesses to monitor performance across dozens or even hundreds of locations without increasing administrative workload.
Whether managing regional operations or an expanding retail network, connected reporting supports sustainable growth.
How WDC Studio Helps Multi-Location Retailers
WDC Studio brings sales, inventory, customer activity, and operational data together in a centralized dashboard designed for growing businesses.
With real-time reporting across multiple locations, retailers can compare store performance, monitor key metrics, and gain a complete view of business operations from a single platform.
By connecting data across different business systems, WDC Studio helps decision-makers respond faster, improve operational efficiency, and make more informed strategic decisions.
Better Decisions Start with Better Visibility
Managing multiple locations requires more than collecting reports. It requires immediate access to accurate business data.
Sales dashboards give retailers the visibility they need to monitor performance, compare locations, identify opportunities, and respond quickly to changing business conditions.
When every location is connected through a single source of truth, businesses can spend less time gathering information and more time making decisions that drive growth.